
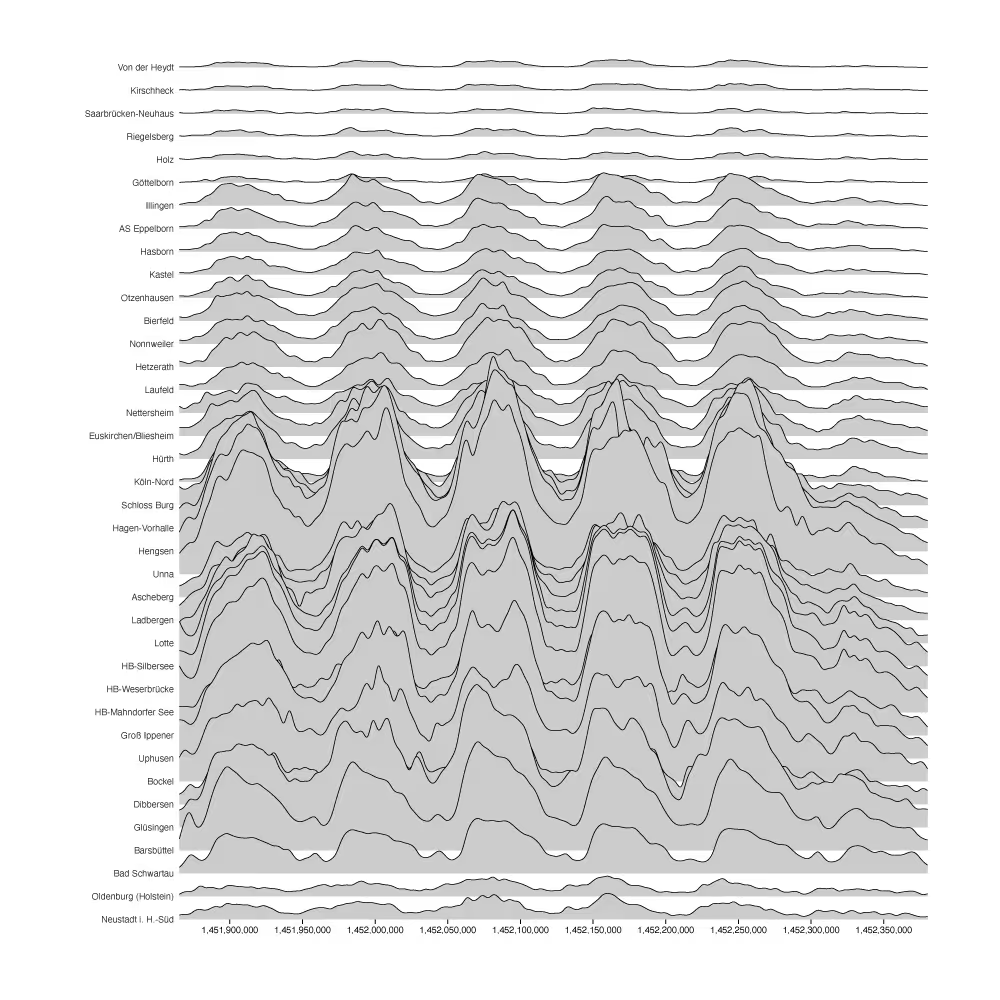

Ridgeline plot
A ridgeline plot (also known as a joy plot) shows the distribution or temporal evolution of several groups over a shared continuous axis. Each group is rendered as a filled area with an optional stroke, stacked vertically with a configurable amount of overlap. The overlapping layout makes it easy to compare many series at once while preserving the individual shape of each distribution. The chart is inspired by the D3 Ridgeline Plot by Mike Bostock.
- Author
- Daniele Ciminieri
- Data sample
- Link