
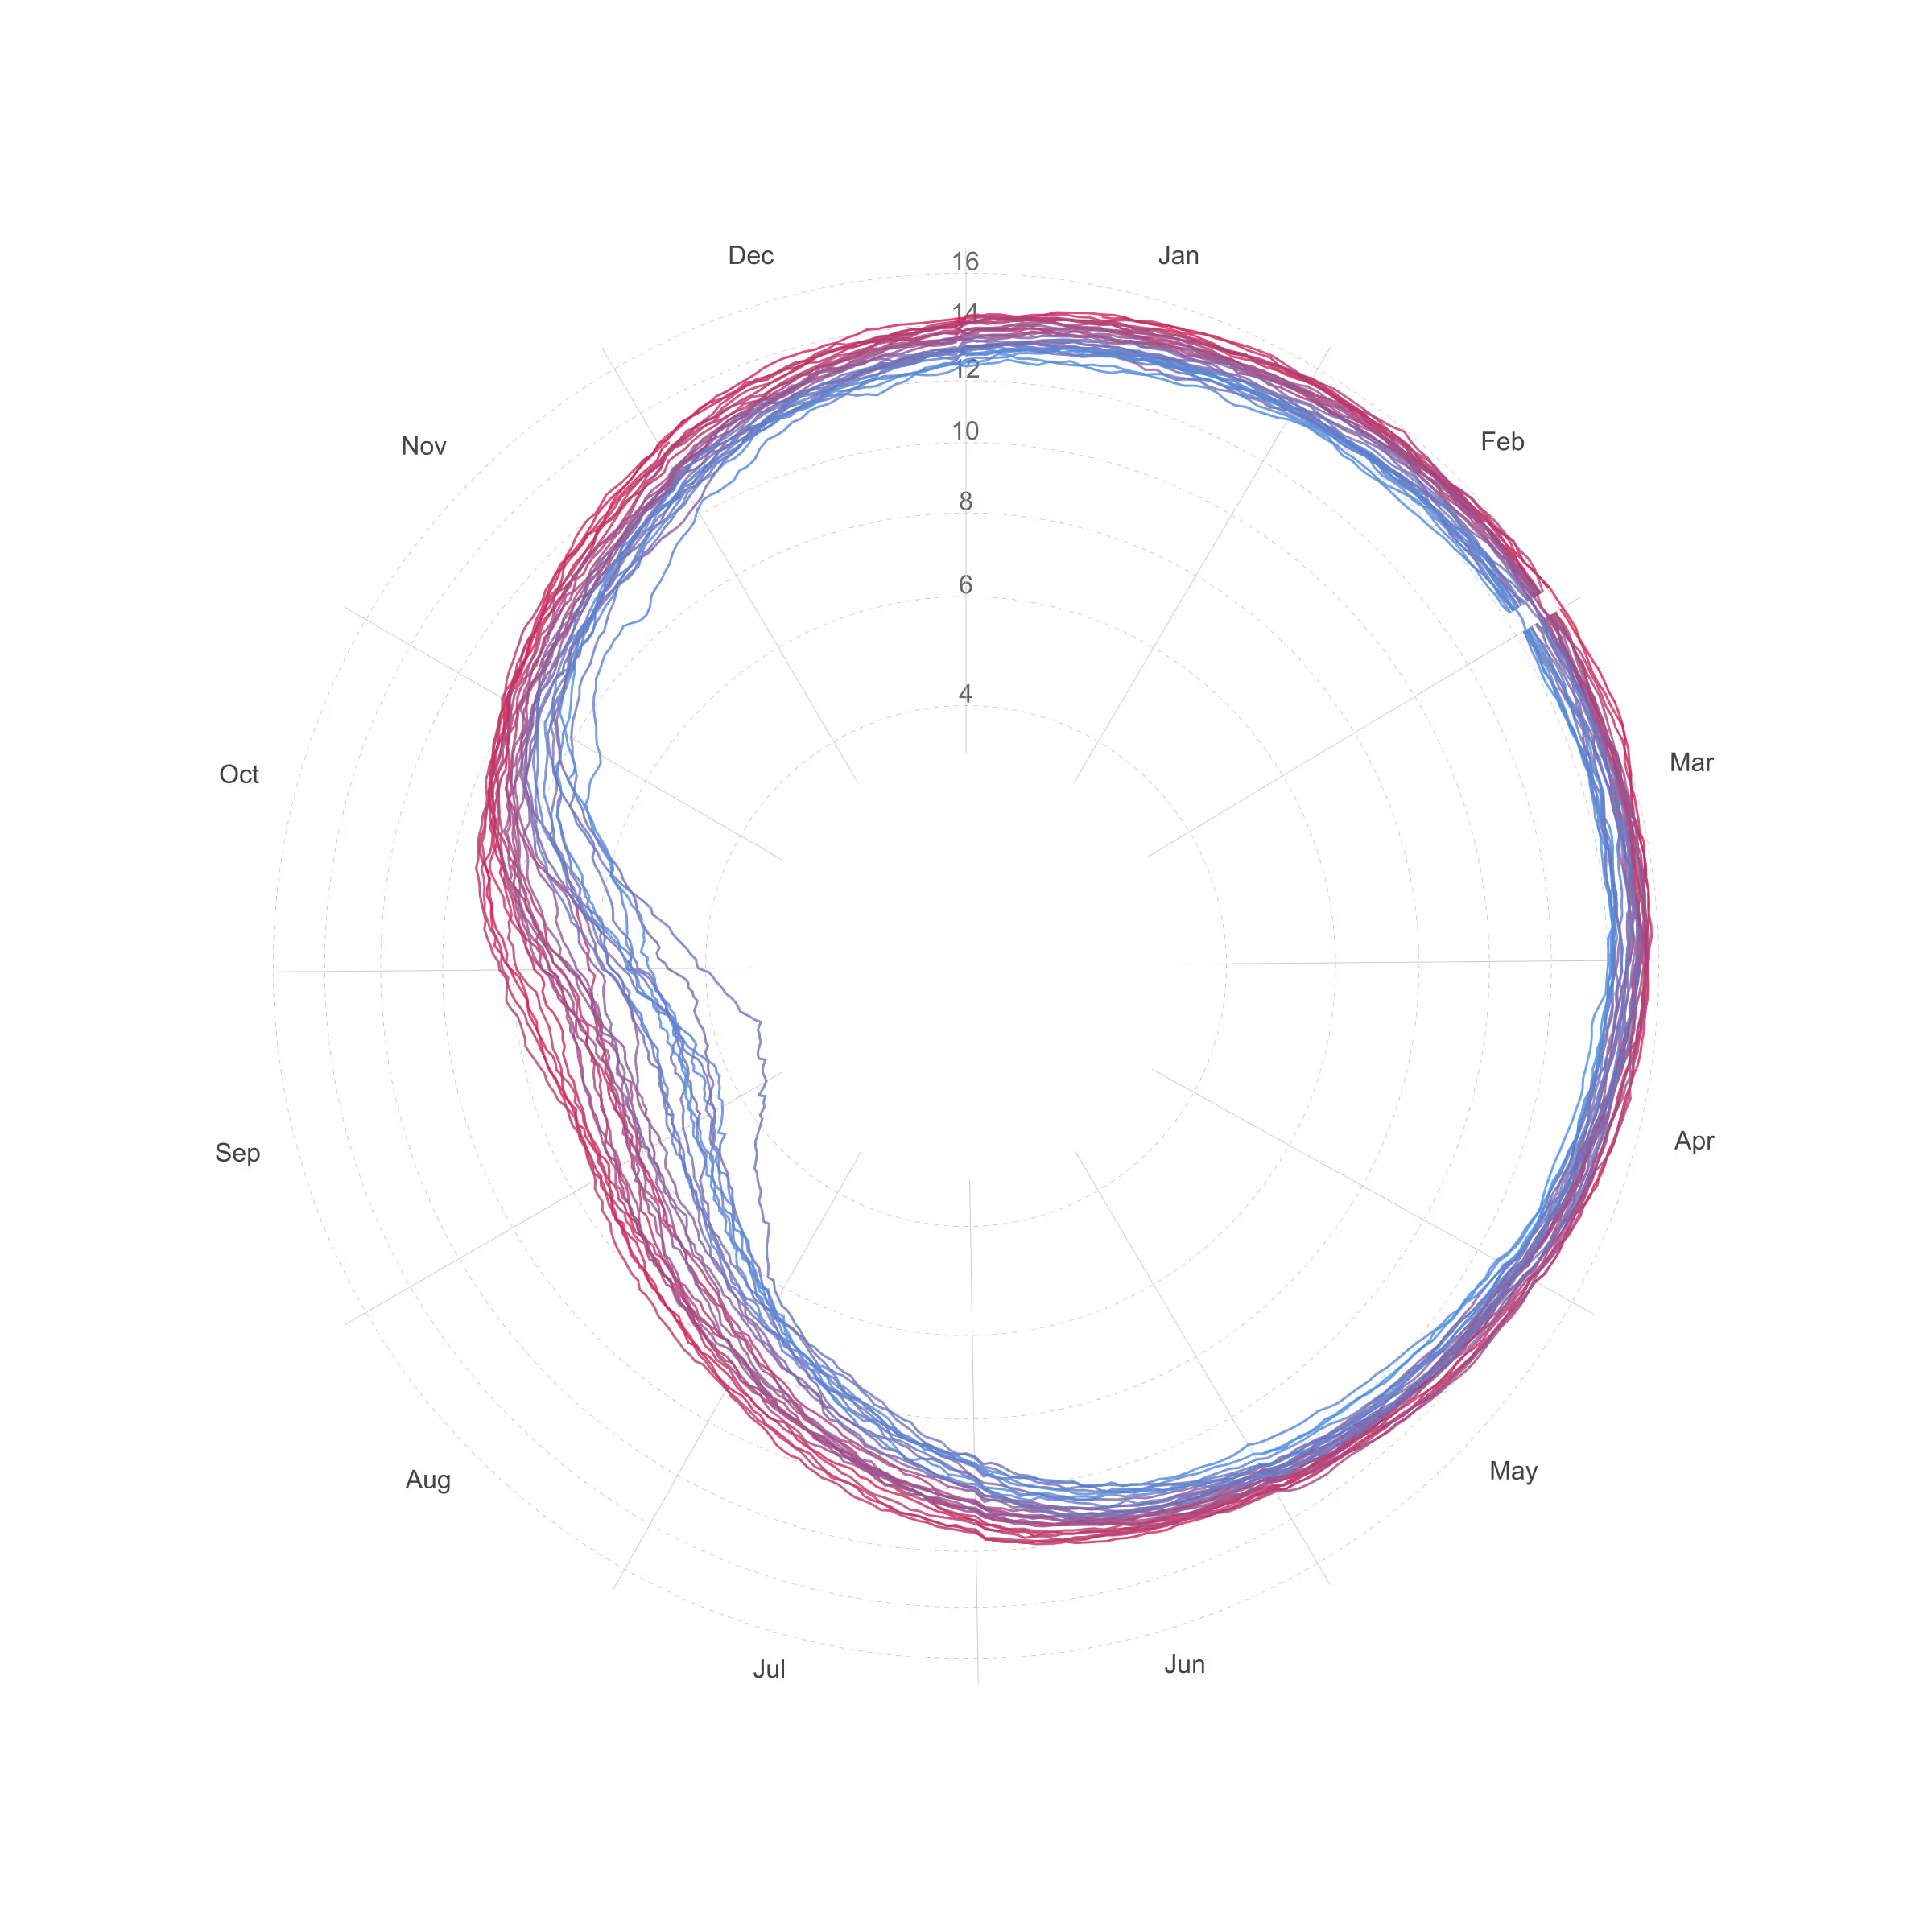
Radial line chart
A radial line chart is a circular visualization designed to display time-based data with a cyclical structure, such as hours of the day, days of the week, or months of the year. Values are plotted along a circular axis representing the progression of time, and connected to form a continuous line that wraps around the center. This layout makes it easier to reveal recurring patterns, seasonal trends, and periodic fluctuations that might be less visible in a linear chart, highlighting how values change across repeated time cycles.
- Author
- Daniele Ciminieri
- Data sample
- Link