
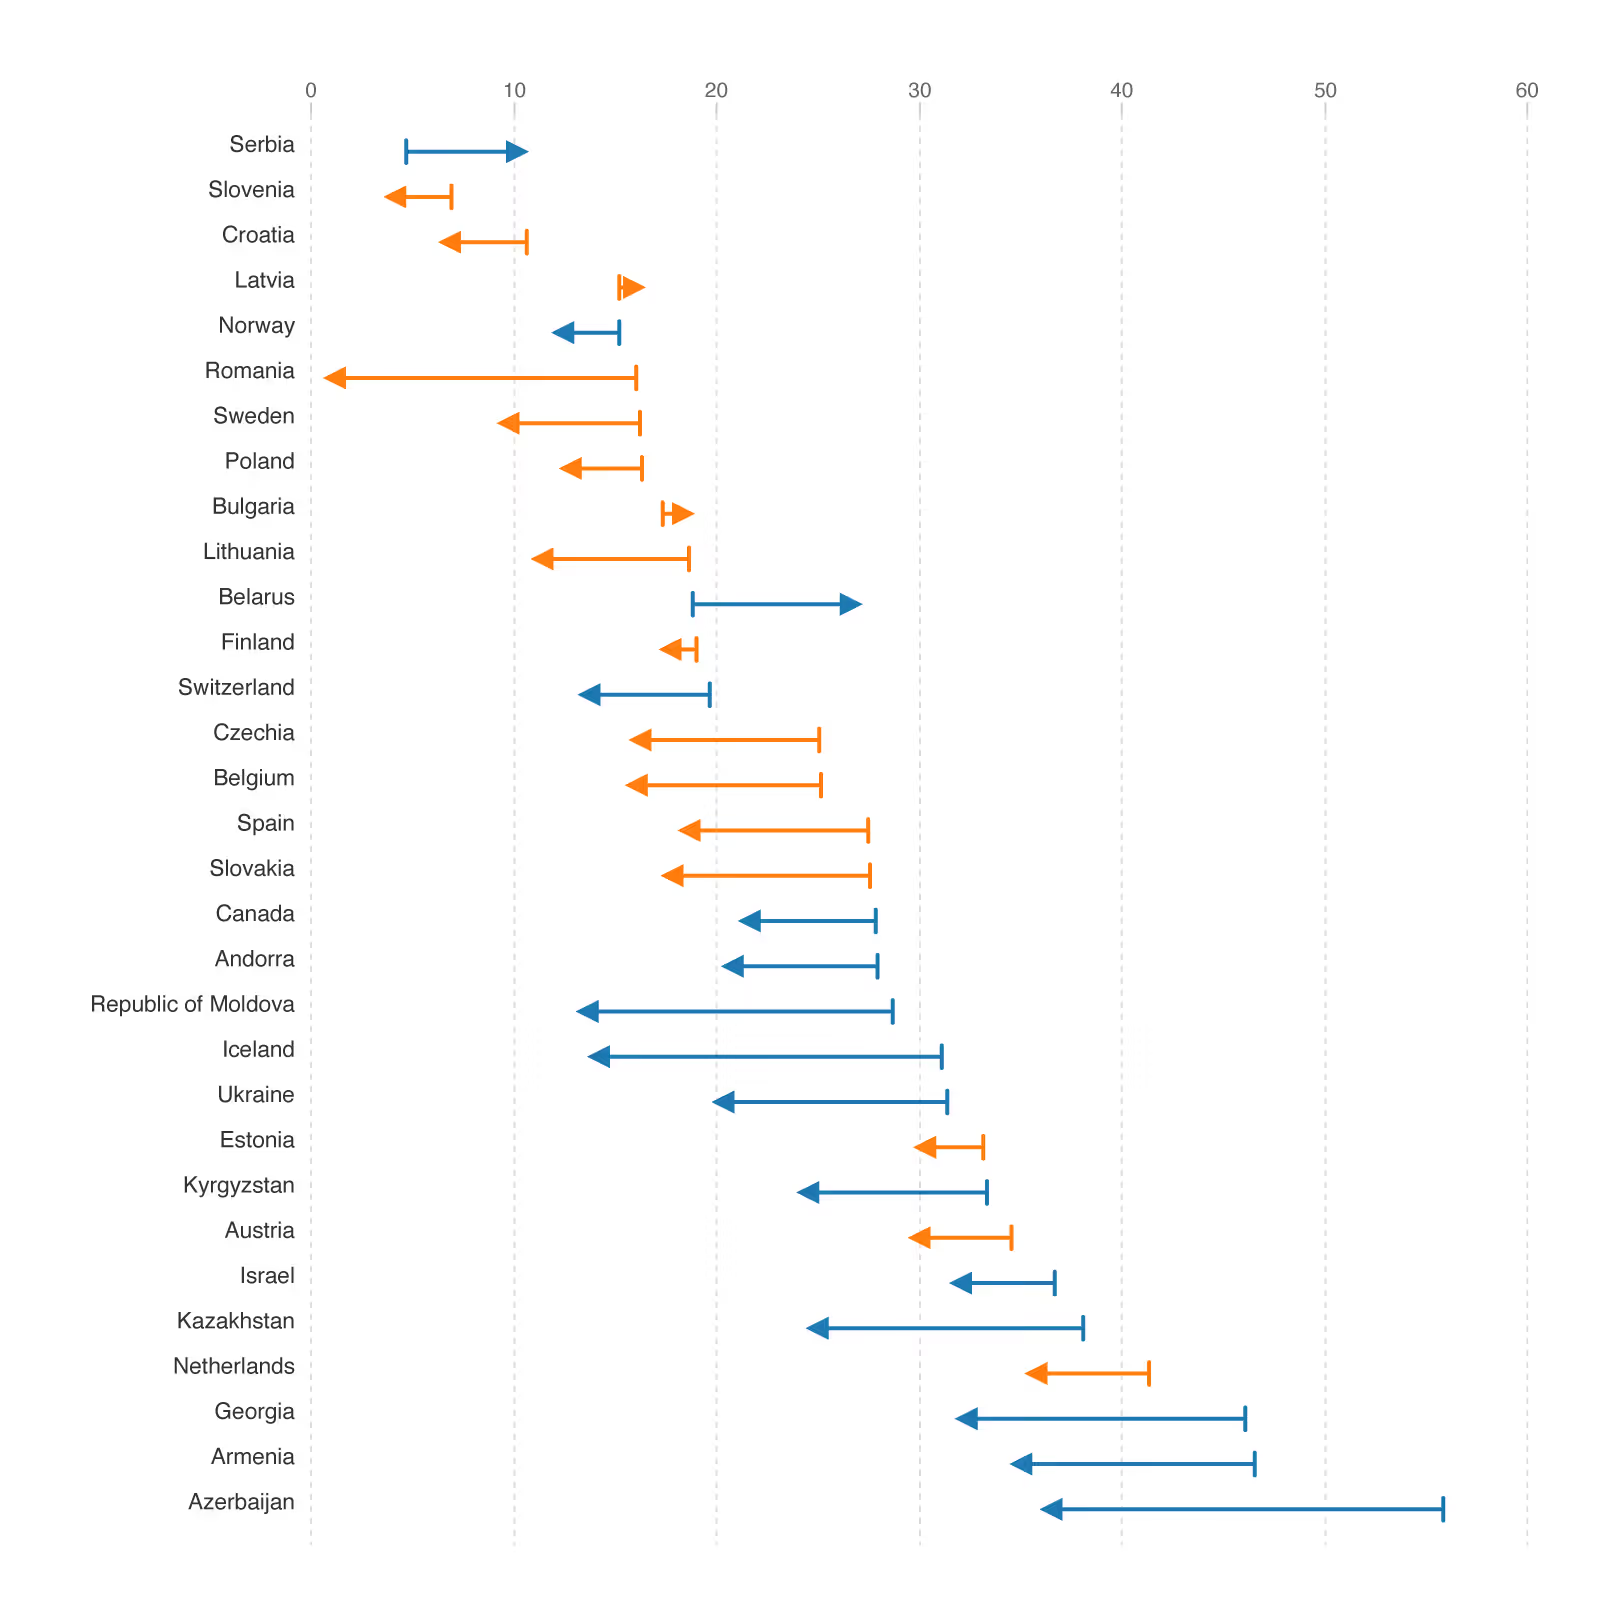

Dumbbell plot
A dumbbell plot with two values compares two numeric measurements for a set of entities. Each entity is represented as a horizontal line segment connecting the two values, with configurable markers at each end (circle, square, arrow, star, or vertical line). The gap and direction of the segment immediately communicate the magnitude and direction of change between the two readings. The chart is particularly effective when comparing values at two points in time, between two categories, or across two conditions. Sorting rows by difference, by one of the values, or alphabetically makes patterns and outliers easy to spot.
- Author
- Daniele Ciminieri
- Data sample
- Link